
Facebook Reels Insights: Full Guide for Brands
Facebook Reels Insights: Full Guide for Brands
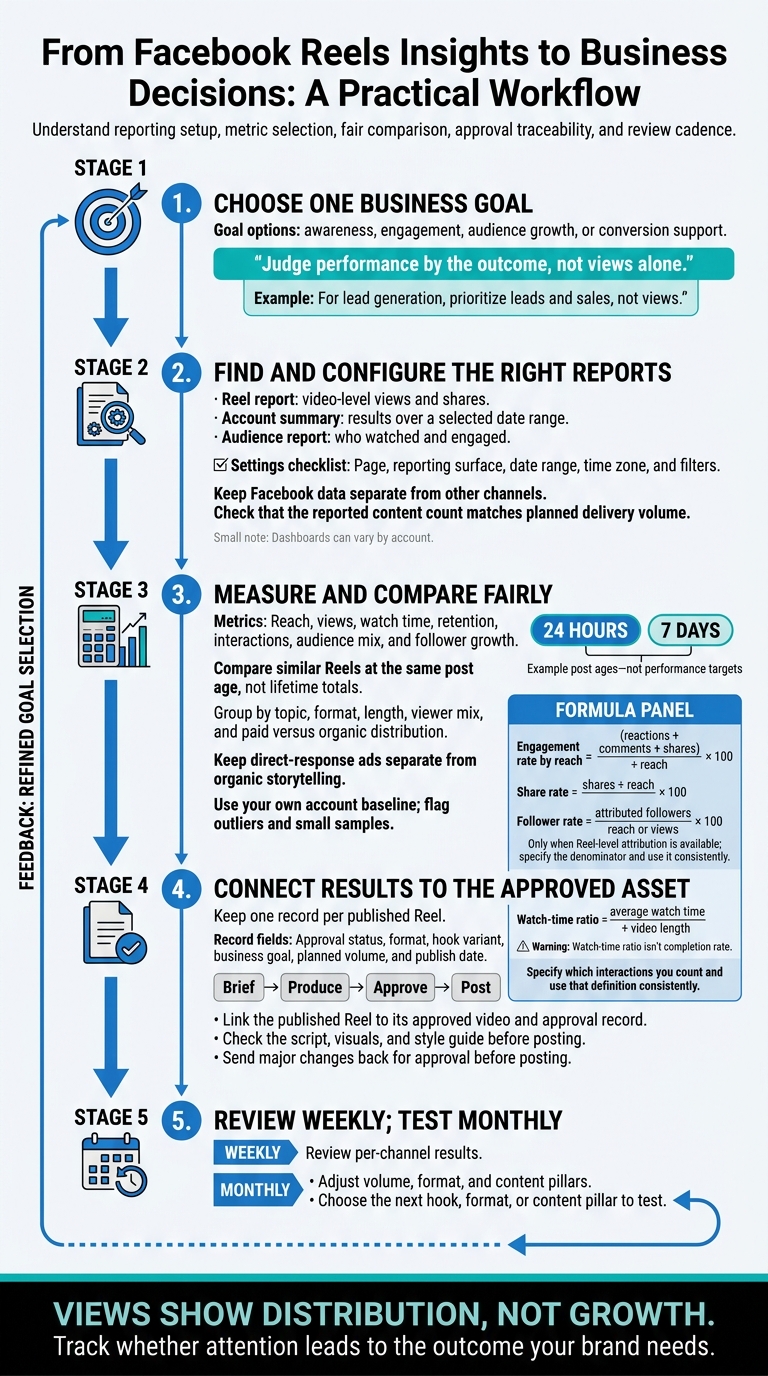
I use Facebook Reels insights to check whether views lead to the results my brand needs. I start with one goal, keep Facebook data separate, and compare similar Reels at the same age - such as 24 hours or 7 days after posting.
Here’s my checklist:
- Find the right reports: Check Reel, account, and audience data for the correct Page, date range, and time zone.
- Measure what matters: Review reach, views, watch time, retention, interactions, and follower growth against your goal.
- Compare fairly: Use consistent rate formulas and separate paid results from organic posts. Watch-time ratio isn’t completion rate.
- Connect results to approvals: Link each published Reel to its approved video, then review results weekly and plan tests monthly.
My rule: <u>judge performance by the outcome, not views alone.</u> For lead generation, that means tracking leads and sales - not just how many people watched.
Facebook Reels Insights: From Views to Business Results
Where to Find Facebook Reels Insights
Access Reel Insights in Meta Business Suite
Before reviewing results, select the correct Facebook Page and reporting surface. Dashboards can vary by account, so check both first.
With the right Page selected, choose the report type you need.
Find Reel, Account, and Audience Reports
Use an individual Reel report to check video-level views and shares. For results over a selected date range, use the account summary. The audience report shows who watched and engaged.
Each view helps guide your brand’s content decisions. Once you’ve chosen a report, set the reporting options before exporting or comparing results.
Record Report Settings and Export Data
Record the Page, reporting surface, date range, time zone, and filters so you can compare results reliably. Keep Facebook selected to avoid mixing results from other channels.
Before exporting, check that the reported content count matches your planned delivery volume. A mismatch can point to missing data or posting delays.
Next, review the metrics for reach, retention, and action.
Understand Facebook Reels Metrics
Reach, Views, Watch Time, and Retention
Compare reach, views, watch time, and retention to see how your Reels perform. Short-form analytics show which Reel formats and channels drive traffic. Results vary by brand, niche, and platform conditions.
Then check engagement and audience data to see who responded and how the Reel affected growth.
Interactions, Audience Mix, and Follower Growth
Interactions and audience breakdowns show how viewers respond and whether a Reel helps grow your audience. Use these signals to choose the metrics that fit your business goal.
Match Metrics to Business Goals
Match your metrics to what you want to achieve: awareness, engagement, audience growth, or conversion support.
For conversion-focused planning, 85% of consumers say video has convinced them to buy. That’s a reason to include metrics that track how your Reels support conversions.
Analyze Facebook Reels Trends
Use the metrics above to compare similar Reels on equal terms.
Compare Reels at the Same Post Age
Group Reels by topic, format, length, viewer mix, and paid versus organic distribution. Keep direct-response ads separate from organic storytelling. Compare totals and rates at the same post age, such as 24 hours or 7 days, rather than using lifetime totals.
Record the time zone, and flag outliers and small samples. Build your baseline from similar Reels on your own account - not a general views target. Track hook, voiceover, and visual variants to see which combinations drive engagement and traffic.
Calculate Engagement, Share, and Follower Rates
Calculate engagement rate by reach = (reactions + comments + shares) ÷ reach × 100. Specify which interactions you count, and use that definition consistently.
Calculate share rate = shares ÷ reach × 100. Reach gives you a more consistent basis for comparison than views, which may count repeat viewing.
Calculate follower rate only when Reel-level attribution is available: attributed followers ÷ reach or views × 100. Average watch time ÷ video length gives you a watch-time ratio, not a completion rate.
Assess Distribution and Video Performance
Before changing your content, check viewer mix and distribution conditions along with hooks, pacing, topic fit, and calls to action. These patterns can help you identify whether the issue is distribution, retention, or response - and choose what to test next.
| Observed pattern | Possible interpretation | Metrics to check | Next review |
|---|---|---|---|
| Low reach with strong retention | Content holds viewers’ attention but has limited distribution. | Hook, viewer mix, distribution settings. | Review hook and distribution settings. |
| High reach with weak watch time | The hook draws viewers in, but the content loses their interest. | Retention curve, pacing, video length. | Review pacing and transitions. |
| Strong views with few interactions | Viewers watch but rarely respond. | Call to action, topic fit, engagement rate. | Test a clearer CTA. |
Set Up Reporting and Approvals
After reviewing Reel performance, link each result to the exact approved asset. Use the performance data to check that the published Reel matches the approved version.
Keep a Reel Reporting Record
Keep one record per published Reel, including its approval status, format, hook variant, and business goal. Tag each Reel by format to compare performance across video types:
AI avatar, digital presenter, cinematic storytelling, or direct-response product ad.
Link the planned volume and publish date to the final result so your report shows what was actually delivered.
Connect Approved Videos to Published Results
Follow a Brief → Produce → Approve → Post workflow. Before posting, check the video against the approved script, visuals, and style guide. Store the approval record with the published Reel to keep the result linked to the approved asset. Send any major change back for approval before posting.
Sun Scroller keeps approvals, publishing, and per-channel analytics in one workflow. Having those records together speeds up weekly reviews and makes monthly tests more precise.
Review Weekly, Test Monthly
Once each Reel is linked to its approved version, review per-channel results weekly and make adjustments monthly. Use the month’s results to adjust volume, format, and content pillars, then choose the next hook, format, or content pillar to test.
Conclusion: Use Insights to Plan Better Content
Use your metrics to plan the next content cycle.
Choose one business goal and track only the metrics tied to it.
For lead generation, prioritize leads and sales, not views.
Check results weekly. During monthly planning, use what you’ve learned to choose the next hook or format to test.
Views show distribution, not growth. Track whether that attention leads to the outcome your brand needs. This keeps reporting focused on business impact rather than vanity metrics.
FAQs
Why are my Facebook Reels insights missing?
Missing Facebook Reels insights often come down to data processing delays or too little engagement data to report useful metrics. Check that your account permissions are set correctly, and give Facebook time to process your metrics.
Sun Scroller handles short-form video production and distribution, including publishing on Facebook. It keeps your videos going out consistently to help maintain visibility in the algorithm.
How can I track leads from my Reels?
Use Sun Scroller’s per-channel analytics to track traffic from your Facebook Reels. To estimate potential leads, multiply your total views by the stated average organic social conversion rate of approximately 2.2%.
Sun Scroller also manages content distribution. Its analytics help you see which video formats and content approaches bring traffic to your brand.
How many Reels should I test before drawing conclusions?
Test at least 48 to 60 Reels per month to identify statistically significant trends for your brand. That volume gives you data across video formats and messaging styles, helping you see what connects with your audience.
Sun Scroller produces 48 to 60 short-form videos each month to support this approach. With a steady supply of content, you can track engagement trends and adjust your strategy based on performance.