
LinkedIn Video Analytics: Ultimate Guide for Brands

LinkedIn Video Analytics: Ultimate Guide for Brands
I start with one business goal - not a view count. For LinkedIn video, I track attention for awareness, clicks for traffic, and conversions for leads. Then I compare similar videos at the same age: 7 days against 7 days, not 7 against 30.
Here’s the approach I use:
- Check the reports: Review Page, post, and Campaign Manager data, including metric definitions and audience fit.
- Set a baseline: Separate organic and paid results, and account for video length, audience, spend, and tracking limits.
- Find what needs testing: Use watch time, engagement, clicks, and conversions as clues - not proof of what caused a result.
- Turn reporting into action: End each monthly review with one test, one owner, and one success metric for the next production batch.
My rule: <u>change one major variable at a time</u>. That keeps the next decision tied to results, not guesswork.
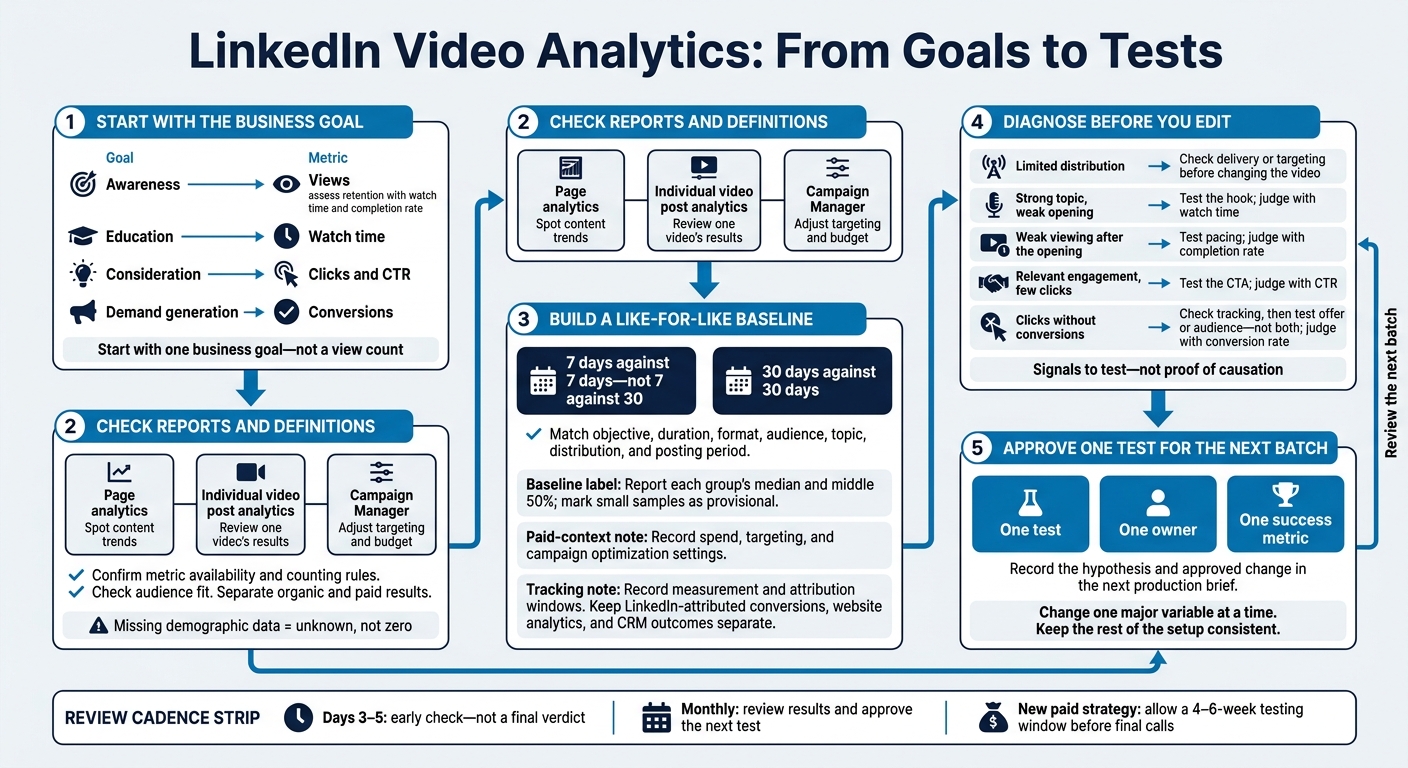
LinkedIn Video Analytics: From Goals to Tests
Understand LinkedIn Video Metrics and Audience Signals
Find Page, Post, and Campaign Reports
Start with LinkedIn Page analytics, individual video post analytics, and Campaign Manager. Confirm which metrics each report provides for your access level and video format.
| Reporting source | Scope to check | Metric categories to verify | Main purpose |
|---|---|---|---|
| Page analytics | Organic Page content; confirm whether sponsored results appear separately | Distribution, engagement, audience breakdowns by role, industry, and location | Spot content trends |
| Individual video post analytics | The selected post; check any sponsored component separately | Views, watch time, interactions | Review one video's results |
| Campaign Manager | Paid campaigns and video ads | Delivery, views, clicks, tracked conversions | Adjust targeting and budget |
Use the same reporting source for each video type to keep performance comparisons consistent.
Define Views, Watch Time, Engagement, and Conversions
Before comparing videos, agree on what each metric means. Check the counting rules, especially when comparing organic and paid results.
| Metric | Meaning or counting rule to document | Use |
|---|---|---|
| Impressions | Times content appears on a screen - not the number of different people. | Measures distribution, not attention. |
| Reach | Members the report says were exposed to the content. | Estimates audience size; differs from views. |
| Views | Reported video plays for the specific format. | Shows whether a topic connects with viewers; views alone don't prove buying intent. |
| Watch time | Total time people spend watching the video. | Helps assess the opening and pacing. |
| Reactions, comments, reposts | Track each interaction separately. | Shows how relevant the content is to viewers. |
| Clicks and CTR | Clicks record interactions; CTR expresses clicks relative to impressions. | Measures response; not every click is a website visit. |
| Conversions; conversion rate | Tracked leads, sign-ups, or sales; conversion rate expresses conversions relative to the report's defined denominator. | Check tracking and the denominator before comparing results. |
Assess Attention, Viewing Patterns, and Audience Fit
Read impressions, reach, and views together to assess distribution. Then check watch time to assess retention.
High views with low watch time signal a weak opening; modest views with strong engagement signal niche fit; high engagement with low conversions signal a CTA gap.
Compare job function, seniority, industry, and location with your intended audience to spot mismatches. Treat missing demographic data as unknown, not zero. Audience breakdowns don't prove who converted.
Set Benchmarks for Comparable Videos
Once you’ve defined your metrics, compare each video only with similar past videos.
Build a Baseline From Past Videos
Use your own comparable videos - not a universal performance target. Group recent posts by organic or paid distribution, objective, duration, format, audience, topic, and posting period. Measure results at the same point after publication: 7 days against 7 days or 30 days against 30 days. Compare views, watch time, engagement, clicks, and conversions separately.
Report each group’s median and middle 50% instead of averages to account for outliers in small samples. Mark small samples as provisional. One strong post shouldn’t set the standard.
For paid videos, also record spend, targeting, and campaign optimization settings. Without that context, a change in distribution can look like better video content.
Choose Benchmarks by Business Goal
Match your benchmark to the business goal. Each goal calls for a different primary metric. Awareness videos can succeed on views and retention alone. Track completion rate alongside watch time to assess retention.
| Business goal | Primary metric | Comparison segment | Review question |
|---|---|---|---|
| Awareness | Views | Same audience, distribution type, and time since publish | Which topics deserve more coverage? |
| Education | Watch time | Similar duration, format, topic, and audience | Should the opening or pacing change? |
| Consideration | Clicks and CTR | Same offer, CTA, audience, and distribution | Does the CTA attract the right visitors? |
| Demand generation | Conversions | Same offer, targeting, spend context, and attribution window | Which videos generate qualified demand? |
Log Video Details and Attribution Settings
Create one record per video with enough context to keep future comparisons consistent. Tag audience or buyer stage, topic, format, presenter style, hook, pacing, CTA, duration, objective, and organic or paid distribution.
Record the publication date and time, measurement window, paid spend, and attribution window. The attribution window is a reporting rule - not proof of causation.
Use consistent UTM parameters and relevant conversion tracking. Keep LinkedIn-attributed conversions, website analytics, and CRM outcomes in separate fields. Log consent requirements, tracking gaps, and attribution limits alongside the results.
Review Results and Plan the Next Video Batch
Build Reports and Schedule Reviews
Use the benchmarks above to turn monthly results into decisions.
Start each report with the business goal. Then separate content metrics from diagnostic signals. Include Views, Watch Time, Engagement, Clicks, and Conversions. For paid campaigns, add Impressions, CPM, CTR, and Conversion Rate. Label totals and rates clearly.
Check delivery and tracking early, and schedule monthly reviews around your content calendar. Use days 3–5 for an early check - not a final verdict. Give a new paid strategy a 4–6-week testing window before making final calls.
Assign Roles and Log Approved Decisions
Every approved test needs an owner. The content owner records video details and hypotheses, while the analytics owner pulls data and checks calculations. The brand reviewer flags comment themes and brand risk. The demand-generation owner checks conversion quality, and a named approver signs off on the next batch.
Small teams can combine roles, but each decision still needs one named owner. If AI helps extract data, a person should check the results and context.
| Finding | Evidence | Confidence | Decision | Owner | Review date |
|---|---|---|---|---|---|
| Attention issue | Watch time, completion, comparable posts | Note sample limits | Test a new opening or gather more data | Content owner | Next monthly review |
| Audience relevance issue | Comment themes, audience signals | Note missing audience data | Test message or targeting | Brand reviewer | Next monthly review |
| Conversion issue | Clicks, tracked conversions | Note tracking gaps | Test CTA or offer | Demand-generation owner | After enough conversion data is available |
Turn Results Into Video Tests
Diagnose before you edit. Check delivery before changing the hook. Low watch time may point to an opening or pacing problem. Strong engagement with few conversions means you should check the CTA, offer, and audience fit. These patterns are signals to test - not proof.
Use the review findings to choose tests for the next batch.
| Finding to investigate | What to change | Test variable | Success metric | Next action |
|---|---|---|---|---|
| Limited distribution | Check delivery or targeting before changing the video | Audience targeting | Impressions and CTR | Check delivery settings |
| Strong topic, weak opening | Shorten the introduction | Hook | Watch time | Test a new opening |
| Weak viewing after the opening | Tighten slower sections | Pacing | Completion rate | Produce one revised edit |
| Relevant engagement, few clicks | Clarify the next step | CTA | CTR | Test one CTA |
| Clicks without conversions | Check the offer and audience fit | Offer or audience - not both | Conversion rate | Review tracking before testing |
Change one major variable at a time and keep the rest of the setup consistent. Repeat strong topics with different hooks, and keep testing until results repeat across comparable posts. For controlled paid experiments, keep other settings consistent, too.
Record the approved test so the next production batch starts with a clear hypothesis.
Conclusion: Connect Monthly Reporting to Video Production
End monthly reporting with one clear decision for the next LinkedIn video batch.
Use Sun Scroller for Monthly Production and Reviews
Sun Scroller supports monthly production with async approvals, channel-level analytics, and review controls.
Turn LinkedIn data into the next production brief at the end of each monthly review. Compare like-for-like videos, then assess business impact through tracked conversions and, when relevant, ROAS.
Before closing the review, lock in the next test, its owner, and the metric you'll use to judge success.
- Audit the batch: Confirm metric definitions so reporting stays reliable.
- Set the benchmark: Compare similar videos to establish a performance baseline.
- Log approvals: Record approved changes in the next production brief.
- Assign one test: Choose one variable and one success metric for each video in the next batch.
FAQs
How many videos do I need for a reliable benchmark?
Post consistently for at least four weeks before evaluating your LinkedIn video performance, rather than aiming for a set number of videos. This gives you time to collect enough data to spot trends in views, watch time, and engagement.
Use those trends to find the formats and hooks your audience responds to. Then adjust your approach and build your next batch around the content that performs best.
Why do LinkedIn and website conversion reports differ?
LinkedIn and website conversion reports measure different parts of the conversion journey. They also use different attribution rules.
LinkedIn uses ad and video signals, including impressions, clicks, and conversion rates. Website reports focus on what happens after the click: how visitors interact with landing pages and whether the site records their conversions.
LinkedIn’s precise targeting often means a higher CPM (cost per thousand impressions). As a result, its audience and click quality can differ from those of overall website traffic.
How can I tell if a video test truly worked?
Measure performance against your business goals - not just views. Let campaigns run for at least 4–6 weeks before judging the results. Each metric tells you something different:
- Views: Whether the topic connects with your audience.
- Watch time: How well the hook and pacing hold attention.
- Engagement: How relevant the content feels.
- Clicks: How well the call to action works.
- Conversions: Whether the campaign delivers business results.
When testing formats, such as AI versus human spokespeople, use identical scripts and budgets, then compare conversion rates. Judge success by the goals you set, such as leads or sales.